Annotating your 3D glacier visualisations#
To enhance the clarity and appeal of your 3D glacier visualizations, we’ve incorporated additional annotation options. This guide will walk you through what’s currently available and how to utilize them effectively. Here’s a brief overview of what we offer:
Arrow annotation (e.g. north arrow)
Point annotation (e.g. labeling a mountain peak)
Text annotation (e.g. adding a heading)
Mask annotation (e.g. indicating the glacier extent from a previous time)
Legend annotation (e.g. adding a legend for the displayed outline)
For more detailed information on each annotation type, please refer to the following sections. Enjoy exploring!
Open data and create 3D object#
import xarray as xr
from glacier3dviz.tools import Glacier3DViz

ds_glacier = xr.open_dataset("oggm_constant_climate_dummy_data.nc")

viz = Glacier3DViz(
    ds_glacier,  # the dataset for visualisation
    camera_args={  # arguments for the point of view
        'azimuth': -135, # rotate the map aroung the z-axis
        'elevation': 20,  # set the elevation above ground of the point of view
    }
)
ArrowAnnotation#
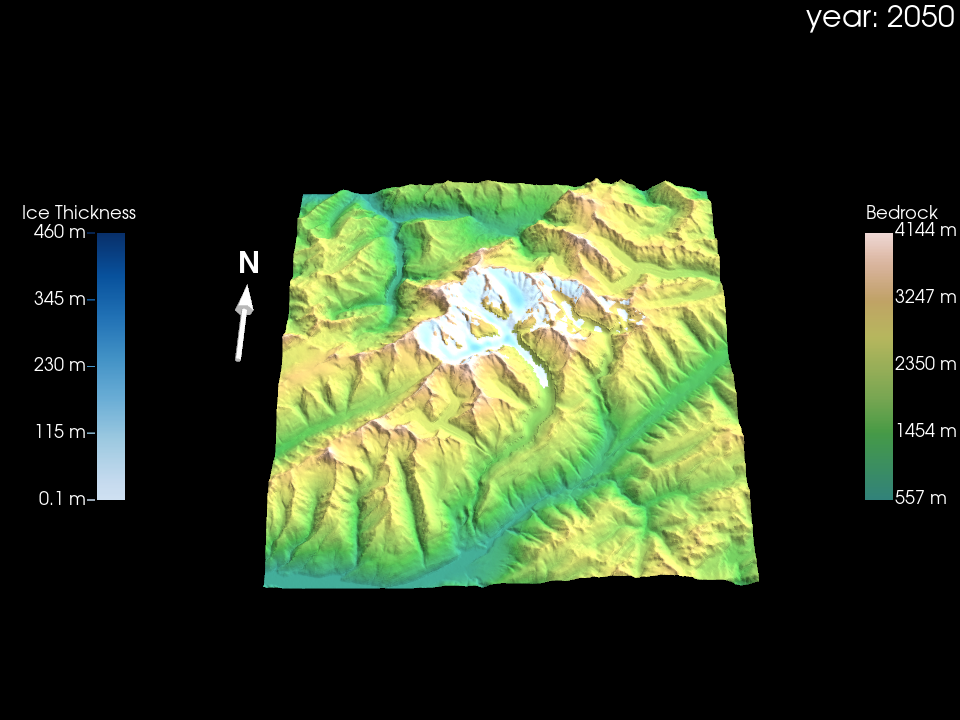
This feature allows you to add an arrow with accompanying text to your plot. You can utilize it to highlight points of interest or provide orientation, such as a north arrow, as demonstrated in the example below.
from glacier3dviz.tools.map_annotations import ArrowAnnotation

# if you want to see all available options uncomment the line below
# ArrowAnnotation?
north_arrow = ArrowAnnotation(
    text='N',
    y_position=0.5,
    x_position=-0.1,
    arrow_magnitude=0.2,
    text_position_offset=[-0.02, 0.02, 0],
    )

viz.plot_year(2050,
              additional_annotations=[north_arrow])
PointAnnotation#
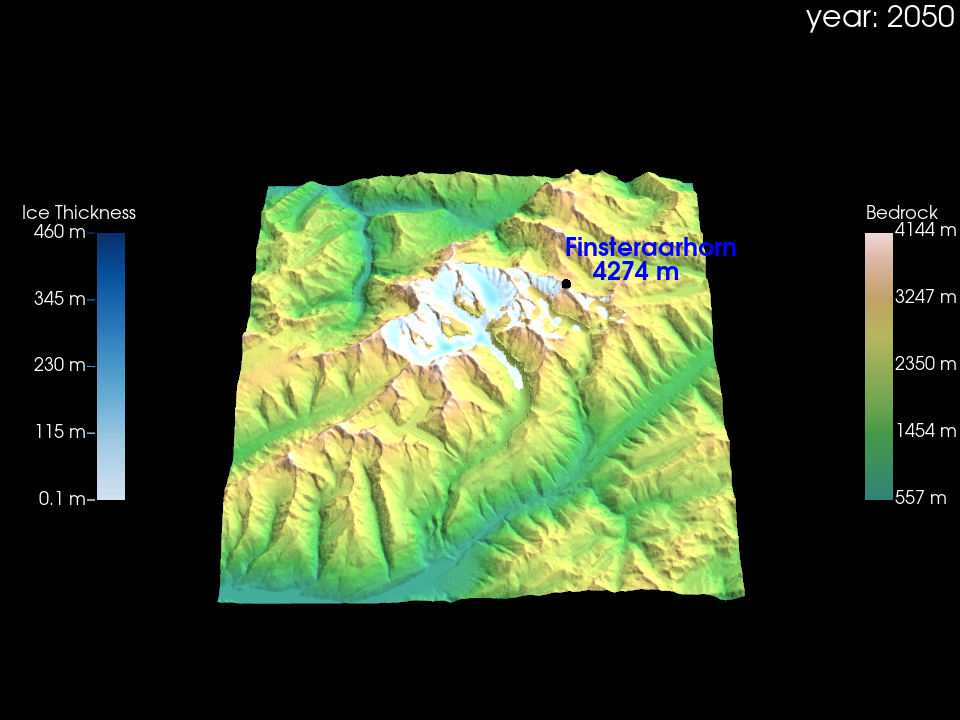
With a point annotation, you can label interesting points in your visualization, such as a mountain peak:
from glacier3dviz.tools.map_annotations import PointAnnotation

# if you want to see all available options uncomment the line below
#PointAnnotation?
finsteraarhorn = PointAnnotation(
    latitude=46.53703, #46.53677,
    longitude=8.12611, #7.96258,
    height=4274,
    text='Finsteraarhorn\n    4274 m',
    font_size=25,
    text_color='blue',
    point_color='black',
    point_size=10,
    shape=None,
    render_points_as_spheres=True,
    always_visible=True,
)

viz.plot_year(2050,
              additional_annotations=[finsteraarhorn])
TextAnnotation#
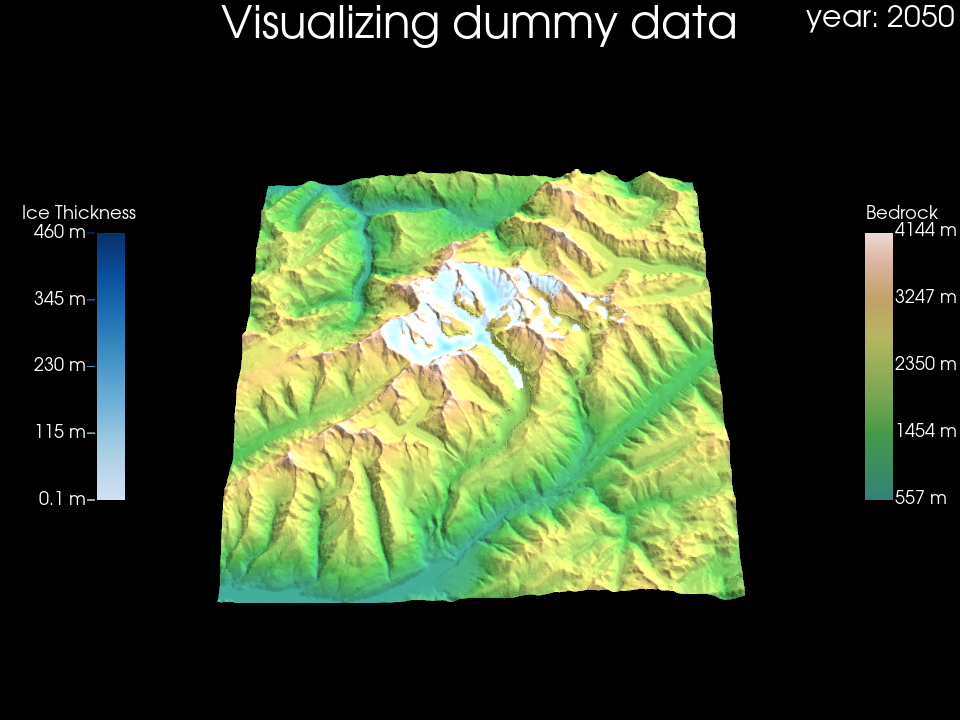
Adding plain text to the visualisation:
from glacier3dviz.tools.map_annotations import TextAnnotation

# if you want to see all available options uncomment the line below
#TextAnnotation?
heading = TextAnnotation(
    text='Visualizing dummy data',
    position='upper_edge',
)

viz.plot_year(2050,
              additional_annotations=[heading])
MaskAnnotation#
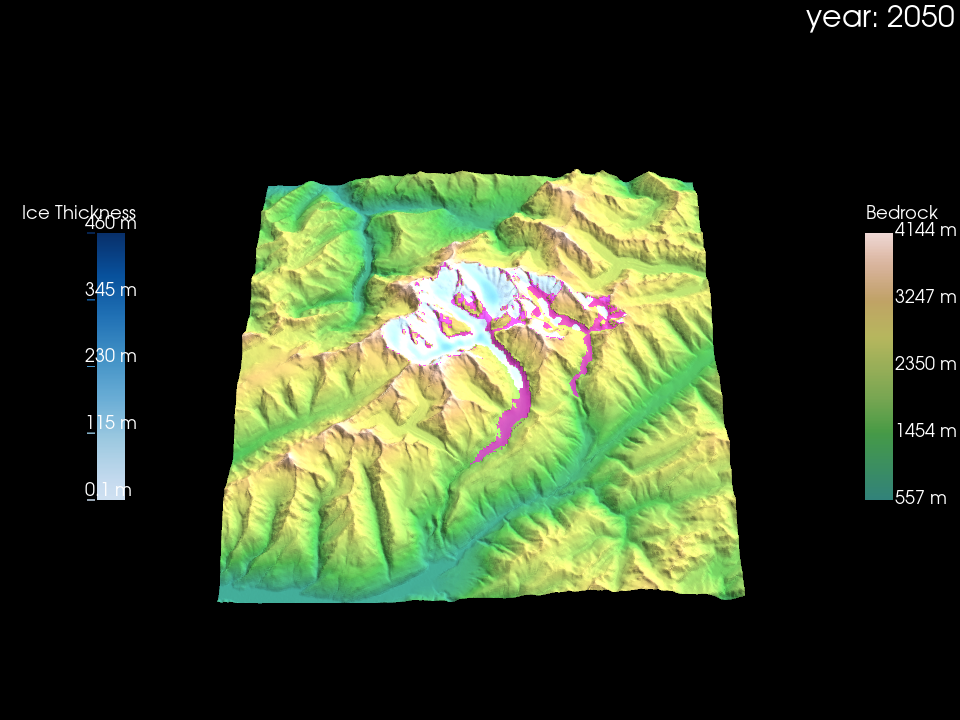
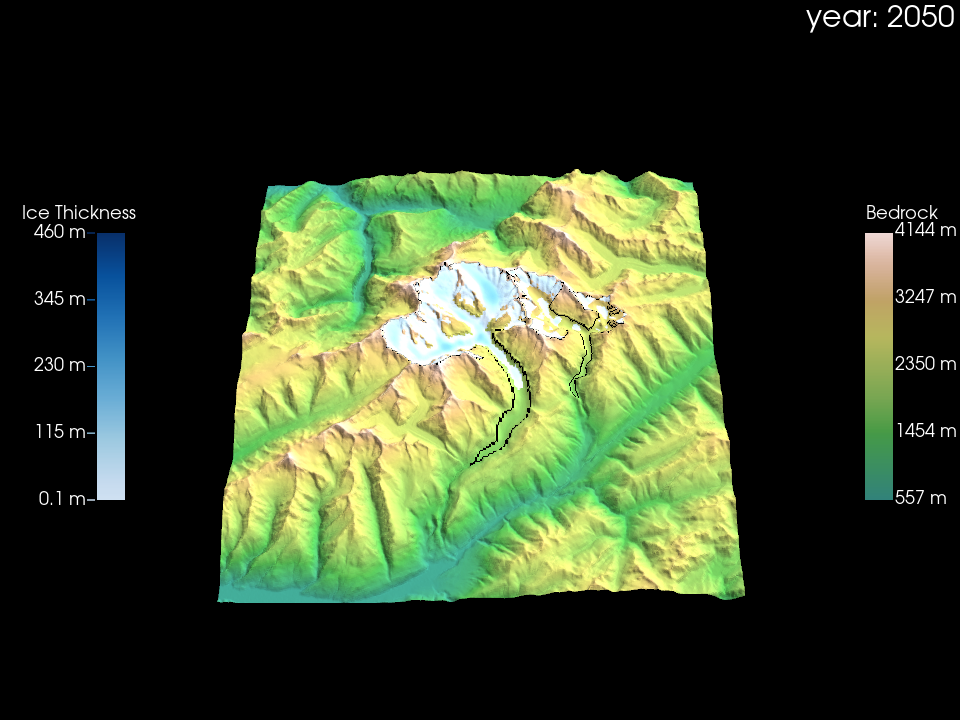
Adding a mask to the topography can be a useful reference tool. This might include displaying past extents of a glacier area or simply its outline. Conveniently, both our test data and the default output from OGGM include these masks. Let’s explore how incorporating a mask can enhance our visualizations:
from glacier3dviz.tools.map_annotations import MaskAnnotation

# if you want to see all available options uncomment the line below
# MaskAnnotation?
outline_area = MaskAnnotation(
    mask_data='glacier_mask',
    mask_color=[255, 0, 255, 150],  # provided in RGBA with 255 convention
    add_z=20,  # make it a bit higher to see everything
)

viz.plot_year(2050,
              additional_annotations=[outline_area])
outline = MaskAnnotation(
    mask_data='glacier_ext',
    mask_color=[0, 0, 0, 255],  # provided in RGBA with 255 convention
    add_z=0.1,  # add some height for plotting the MaskAnnotation on top of topography
)

viz.plot_year(2050,
              additional_annotations=[outline])
LegendAnnotation#
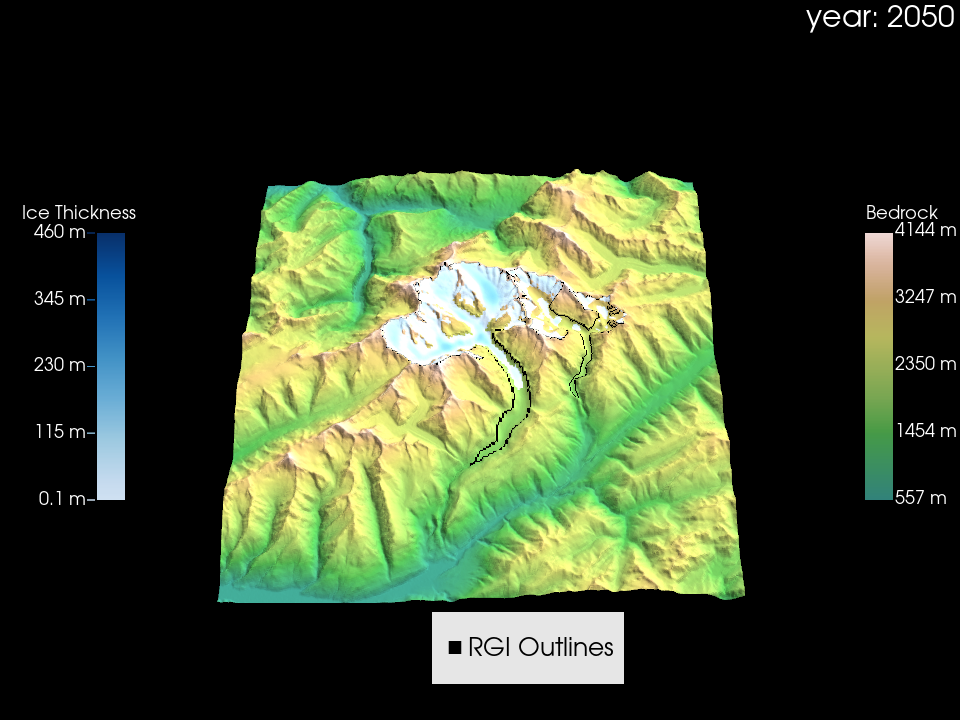
To provide additional information about what is displayed, we can include a legend, for example, for the outline added above:
from glacier3dviz.tools.map_annotations import LegendAnnotation

# if you want to see all available options uncomment the line below
# LegendAnnotation?
outline_legend = LegendAnnotation(
    labels=[[' RGI Outlines', 'black']],
)

viz.plot_year(2050,
              additional_annotations=[outline, outline_legend])
All Annotations together#
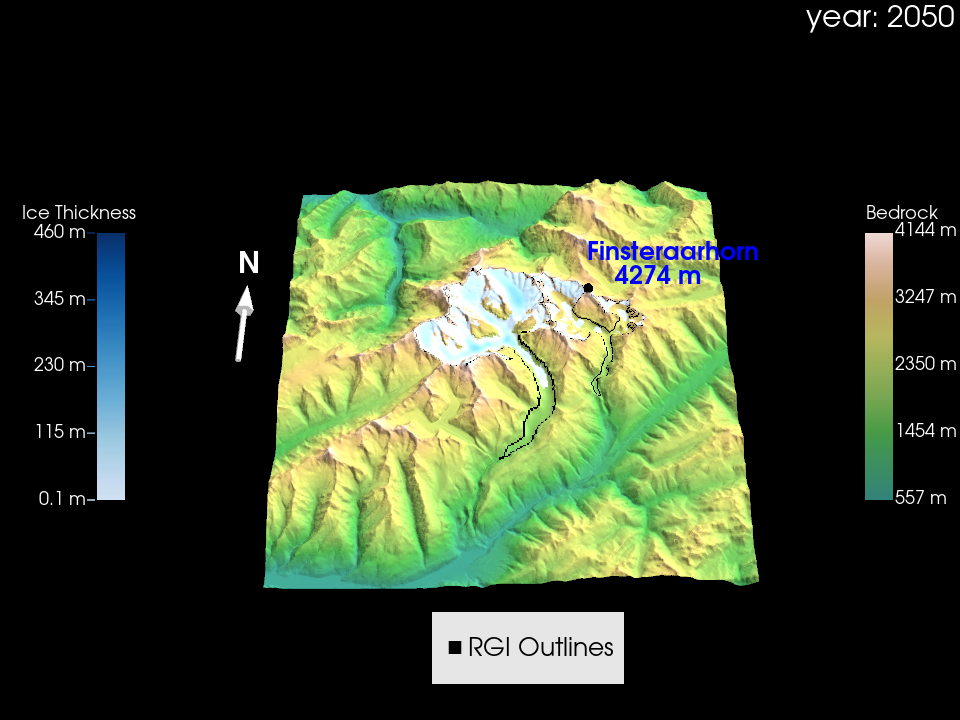
For adding multiple annotations you just can provide them as a list:
viz.plot_year(2050,
              additional_annotations=[north_arrow, finsteraarhorn, outline, outline_legend])
What’s next?#
Check out Advanced Visualizations
Check out General styling of 3D visualisations
Or back to the table of content